
Release Notes
Coming soon - food ingredient tracking!
(also, version 5.18.13 released)
16 Apr 2026
Hey spoonies! 👋🥄 It’s been an unusually long time since the last feature update to Chronic Insights (4 months!) so I just wanted to post an update to let you know what’s happening behind the scenes. I’ve been working away on a highly requested feature which I’m really excited about: food ingredient tracking. I’ve also just released a few community-reported bug fixes (see below), thanks to everyone who has helped with that 🙏
Food ingredient tracking
The number of you who have asked for some kind of food diary feature speaks to how important this is to so many of us who live with chronic illness, and for good reason. The increasing scientific consensus that diet can play a significant role in a lot more chronic illnesses than we have previously thought aligns well with the common-sense intuition that we are what we eat. My personal discovery that I have FODMAP intolerance was a breakthrough which significantly improved my quality of life, which was especially welcome given that I was in the middle of a huge flare-up of my auto-immune disease and was rapidly losing weight.
Unfortunately, identifying if you have some kind of intolerance to one or more ingredients is extremely difficult given the variety of foods and drinks available to us, and because effects may be delayed, which is why food diaries have become a valuable tool.
The reason I haven’t attempted this feature until now is that it’s extremely complicated and quite a daunting task to take on on my own!
Here are the general principles I’m trying to follow:
Ingredient tracking is time consuming and tedious. Where possible the app should auto-complete what you’re trying to enter, and try to lookup ingredient lists for you. For the same reason, quantities will be optional, and categorised simply as ‘a little‘, ‘some‘ or ‘a lot‘ - specifying exact weights, counts and other measurements is incredibly complicated for me to code, and I think not particularly useful if you just want to know ‘does this ingredient trigger my symptoms?‘
Focus on ingredients, not calories or nutrition. While these are useful for some people, there are tons of apps for calorie counting which will do a much better job than I can. What is missing is a good *ingredient* tracker: simply being able to track what ingredients were consumed.
As with everything else in my app, there will be no data collection, or at least not by default. However I am considering providing an opt-in option to allow me to anonymously store what ingredients you enter for foods the app doesn’t know about, to help me build up a better food database. This will help with the first point: making the food diary easier to use.
Here’s roughly how it will work:
A new item you can add to your diary: food ingredient tracking
You will be able to enter the name of a food, drink or snack (with auto-complete), and the app will attempt to lookup an ingredients
You can check and amend the ingredients if they are wrong
You can then create ‘trigger ingredient sets‘: lists of ingredients which you think might be triggers for your symptoms. This will allow you to overlay a chart of when you eat these ingredients with your other charts, like a fatigue symptom
Here are some limitations, at least in the initial version:
No barcode scanning: I looked into this a while ago, and it turns out that different countries have different barcode systems, and getting access to each country’s barcode databases is way more expensive than I can afford. So unfortunately I won’t be able to add this.
No AI photo scanning: this might be something I will consider for a future version, but the ability to take a photo and get some kind of AI system to guess what it is and what ingredients it contains won’t be in the initial version. Firstly, I’m not entirely sure how I feel about using AI in the first place, for various ethical reasons. Secondly, the price of using AI services will almost certainly increase dramatically in the near future as the big AI companies realise that at some point they have to turn their cash-burning furnaces into some kind of profitable business model (and also the coming server memory / component shortage will soon bite hard, raising cloud server prices too): that’s just something I won’t be able to afford right now.
Initially auto-lookup and suggested ingredient lists will be English language only
I’ve been working on this since January and is looking like it will take me at least another couple of months, but I’m so looking forward to seeing if this is useful to everyone who has asked for it. If you want to join in the early Android beta when it arrives, let me know, and join the Chronic Insights beta on the Play Store. And if you have any suggetions or feedback on my ideas, please let me know! james@chronicinsights.com
Bug fixes
Thank you so much for everyone who has written in with bug reports over the past 4 months. Thanks to you I’ve been able to release a number of updates over the past few days to address some subtle bugs which only appear in certain scenarios and edge cases. As it’s just me working on this app, and because I have to work within the limitations I live with due to my chronic pain and fatigue, there’s only so much testing I can do on different combinations of phones, regions, languages, symptom diary setups etc. so I really rely on kind folks like you who find issues and problems writing in to let me know. Thank you 🙏
Here’s a summary of these bug fixes:
Fixed prolactin blood test chart not showing (I made a mistake with the units of measurement which meant the app wasn’t sure how to show the chart)
Fixed body temperature chart from Health Connect and Apple Health showing odd numbers when units set to Fahrenheit (another units of measurement mistake!)
Fixed medication dose change notes not attaching to dose change record when added retrospectively (when editing dose change records, I forgot to link any newly created note to it’s dose change record)
Fixed spreadsheet export not working for some people (an odd problem with vitals - I’m still not entirely sure how this problem surfaced, but it’s fixed now!)
Fixed decimal point not available when entering medication strength on iOS (I forgot to ask iOS to enable decimal points when showing the keyboard for the strength text box)
Improved colour of background chart when smoothing enabled for greater clarity (if you enabled smoothing on a discrete bar chart with lots of data, the semi-transparent bars would overlap and look really odd and made reading the chart difficult - so I changed the colour to a solid instead of semi-transparent)
Improved 3D demo timeline chart
Improved Apple Watch app icon (Apple all of a sudden didn’t like the fact that the app icon was provided with a black background because it broke one of their pedantic design rules about Apple Watch app icons looking round!)
And as sometimes happens in software development because it’s so crazy complicated (especially when you have brain fog!), when I released the above updates, I accidentally broke weather location lookup! So I also fixed that in another update:
Fixed weather location lookup not working
Version 5.18 released
17 Dec 2025
Hi spoonies 👋 I hope you’re doing reasonably well today given everything you’re probably going through if you have a chronic illness. If you’re not, know that you’re not alone. I’m always here if you need someone to talk to over the holidays 🫶🏻❤️🩹
There are lots of new features in this new version of Chronic Insights, thanks again to all your great suggestions and feedback. Thanks so much for everyone who has written in or left reviews for my app on the app store, it really means a lot.
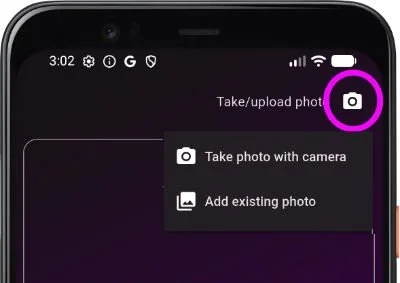
Upload existing photos
This was requested from a number of people. When you create a note, there is the option to add photos - but previously you could only take a new photo using the camera. In version 5.18 the photo button now reveals a menu where you can choose to take a new photo or upload an existing photo from your gallery
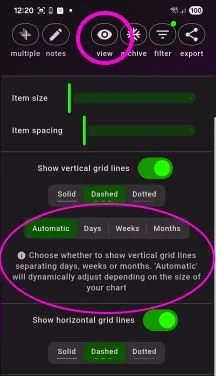
Align vertical grid lines with days, weeks or months
By default, when you enable vertical grid lines, the app will decide automatically how many vertical grid lines to draw, and where to draw them, so that there are a always a handful of lines drawn regardless of what time span is being viewed. If you prefer, you can now override this to always show vertical grid lines to show the start and end of days, weeks or months.
More blood tests
I’ve added the following options for recording blood test results: parathormone, reverse T3, calcium, phosphorus, rheumatoid factor, blood ketones, lipase, DHEA sulfate, prolactin, C3 & C4 complement, anti-la SSB, ANA, immature granulocytes, chloride, carbon dioxide, globulin
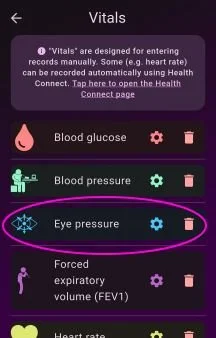
Eye pressure
Eye pressure has been added as a vital, which allows you to record intra-ocular pressure in each eye (in mmHg). To use, scroll down to the bottom of your list in the Diary tab and tap on ‘Add diary item‘, then choose Vitals, then enable Eye Pressure.
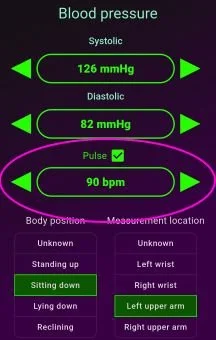
Record pulse with blood pressure
There is now the option to record your pulse when using the blood pressure vital. This will show as an extra piece of information in your data table.
Enabled gradient colours and reference lines on blood glucose charts
Version 5.17 added the option to change the fill colour of charts to a colour gradient, and to add horizontal reference lines (see below). I needed a bit more time to enable these options for blood glucose, as this chart is a bit more complex. These options are now available for blood glucose.
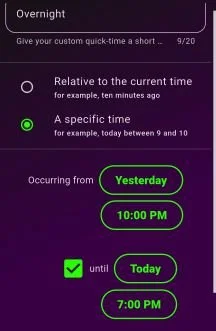
Quick times spanning midnight
Previously, when creating a custom Quick Time for a specific time, you could only set the start and end to be within the same day. I have now added the option to have the start and end on separate days, so you could for example have a Quick Time for quickly entering “yesterday from 10pm to today at 7am“.
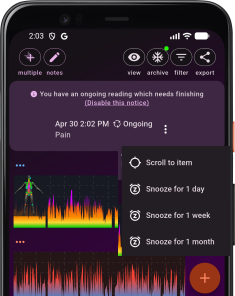
Reminder notice of ongoing symptoms
A few users wrote in to ask for some kind of reminder of diary entries which they have entered using the ‘ongoing‘ duration, leaving the end time to fill in later - it can be easy to forget to come back and complete the diary entry, for example when an episodic symptom has stopped. I have added this reminder notice at the top of the diary if there are any ongoing readings, with options to disable the notice or “snooze” individual items.
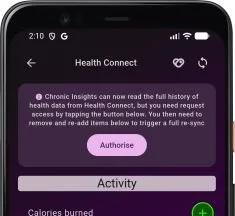
Read full history from Health Connect
When Health Connect first launched as a beta, apps were only allowed to read up to 30 days of historical data. Newer versions of Health Connect now allow apps to read the entire history. If you are already using Health Connect you need to grant the app an additional permission. To do this, open the Health Connect integration page (for example, by opening the main settings menu, expanding the ‘Symptom Diary‘ submenu, and tapping on Health Connect), and you should see a notice at the top with an authorisation button. You will then need to remove and re-add any data items for which you want to read the full history so it triggers a full resync.
Fixed an issue with Health Connect syncing
Some users experienced problems with Health Connect not syncing to Chronic Insights. This was because of a mistake I made which caused the sync process to get stuck in an infinite loop in certain scenarios. Syncing should now work. This may also imrove the overall performance of the app for people who were affected because it won’t be constantly trying to sync in the background!
Other minor fixes and improvements
Added a symptom label to the top of the 3D heatmap view, to remind you which symptom you’re viewing
You can now add notes to body measurements
Added a new questionnaire for pulmonary fibrosis
Simplified camera controls by using the built-in camera UI
Added some translations for American English (eg color instead of colour, hemoglobin instead of haemoglobin) - if you spot any other translations need adding please let me know!
Added missing watch icons for sitting and standing
Improved error reporting
Improved x axis labelling for large time spans
The Photos page now shows related diary items attached to photos
Version 5.17 released
29 Oct 2025
Hi spoonies, it’s been quite a while since the last app update back in March. The main reason it has been so long is that I moved house during the summer - not only was this a very stressful experience (as anyone has moved house will know!) but this in turn also triggered some flareups in my axial spondyloarthritis, I think probably due to the stress, and also getting out of my usual exercise / stretching / relaxation routines which are so vital in keeping my pain and fatigue under control. So because of this, I had to take extensive periods away from my computer to rest. I’m only just now catching up with all my emails, so thanks to everyone who has emailed and sorry it’s taken me a really long time to get back to you!
Version 5.17 required some extensive work under-the-hood to bring the latest features to life. I’ve basically rewritten part of the app responsible for storing different configuration options for diary items, so that I could more easily add more settings which you will see below.
As always, this new version will be initially released only on Android to users who have signed up to the beta version on the Play store. Release to the public on Android and iOS will hopefully follow shortly after.
Version 5.17 contains the following new features and updates:
More chart settings
The following new chart settings apply to blood tests, body measurements, custom measurements, fitness, questionnaires, symptoms, urine tests, vitals and weather.
Change the fill colour of charts to a vertical colour gradient
The idea for this new setting was emailed to me by a user. They wanted to be able to have their chart change colour the higher the value is on the chart. So for example, higher values can be coloured in red, to more easily see when a symptom becomes more severe.
See the new user manual section on chart fill colour for more details, and learn how to configure your own colour gradient with your own colour scheme.

Horizontal reference lines
This new setting is in response to a request I had from a user who wanted reference ranges for their blood tests, so that they could see if they go above or below the ‘normal‘ range. Not being a doctor, and knowing that what is ‘normal‘ can change depending on the individual, I wasn’t comfortable adding set reference ranges, as this might seem like me giving medical advice, which is something that I’m careful never to do in my app. So instead, I created a new chart setting which allows you to add your own reference lines to your charts to whatever values you want. So for example, you could add a line to a CRP blood test chart showing when it indicates inflammation, and when the inflammation is ‘severe‘ accoring to your body.
See the new user manual section on reference lines for more details.

Pin chart Y axis to a set range
Again, this was inspired by a user who wrote in. They wanted to be able to set the Y axis for a particular chart to a narrower range, so that they could more easily see the fluctuations between two particular values. I thought this might be useful for others too, so you can now change how the Y axis behaves by choosing one of these modes: data range (the Y axis adjusts automatically to span the data range entered so far), full range (the Y axis will always span the full possible range of values), anchor to zero (the Y axis will always start at zero) and fixed range (you set your own minimum and maximum values to pin the y axis to).
See the new user manual section on y axis range for more details.
Improved smoothing
Smoothing is now faster and works on more diary item types. It also now shows the un-smoothed chart in the background, so you can compare the smoothed moving average line to the original data.
See the new user manual section on smoothing for more details.

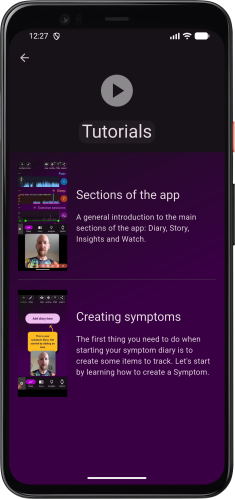
Video tutorials
By popular demand I have started creating some video tutorials! I have only made 2 so far, as they are surprisingly time consuming to create, so keep checking back as I add more in the future.
You can access the tutorials from the main settings menu (using the settings button which is in the bottom left corner on the phone version of the app, or top right corner on the tablet version of the app)
Version 5.17.5 hotfix
A subsequent hotfix version included the following bug fixes:
Fixed restore of backup from OneDrive
I finally managed to fix a strange problem causing backups on OneDrive to appear ‘invisible‘ to the app when restoring from backup. Basically, even though backup files were being saved successfully for people using OneDrive as a backup location, due to a problem with the Microsoft API when checking the backup, the app could not access the saved files, so thought there was nothing to restore. This resulted in a “Backup not found“ message appearing to users attempting to restore from OneDrive.
Thank you to those who reported this issue, and apologies to those affected. This had previously worked fine when I orginally developed and tested the backup to OneDrive feature, so I’m not sure what changed to cause this bug. I suspect that something changed in Microsoft’s API which the app uses to interact with OneDrive.
I had previously given a workaround for this issue, which involved moving the backup files to another provider (Dropbox or Google Drive) and restoring from there instead.
This hotfix fixes the issue, so you should now be able to restore from OneDrive. If you have moved your backup to Dropbox and Google Drive, you can follow the How to Backup instructions to unlink your backup from Dropbox or Google Drive, and then relink to OneDrive. It’s probably then a good idea to do a backup right away so you have an up-to-date backup in OneDrive.
For anyone who is a developer and you’re interested to learn more about this issue and why it came up, here’s some more technical details on Stack Overflow!
First donations made from the ❤️10% for charity initiative
August 2025
In August I was really pleased to be able to make the first donations from my ❤️10% for charity initiative, where I donate 10% of app subscriptions to chronic illness charities. £743 was donated in total. You can see the breakdown in the donation report.
Note: Since the charity initiative was launched, one of the participating charities called GAIN (dedicated to supporting people affected by Guillain-Barré Syndrome, CIDP, MMN, and other related inflammatory neuropathies) has renamed itself to Inflammatory Neuropathies UK. People using version 5.16 or earlier of the app will see this charity listed as GAIN. Version 5.17 will list the charity with it’s new name, Inflammatory Neuropathies UK.In version 5.17 of the app, The Patients Association will be added as an additional participating charity.Version 5.16 released
24 Mar 2025
Hi spoonies, I’m so happy to announce the release of version 5.16 of Chronic Insights, because this comes with a major new development: the launch of my new ‘❤️ 10% for charity‘ initialtive! Also, a few extra features, including the ability to record custom measurements.
Initially 5.16 is only available people who have signed up to the beta version for Android. The plan is to release it to everyone on 1st April 2025.
❤️ 10% for charity
When I first started developing my symptom diary app, it was just a hobby. I looked at all the symptom diary apps on the app store, and I just didn’t like any of them. So, I thought, wouldn’t it be fun to try making my own. I had no idea that years later it would grow into what it’s become: a passion project, launched on the Play Store and the App Store and used by people from all over the world to help manage their chronic illness.
Part of the reason I’m still working on it today is the unbelievable feedback, encouragement and support I’ve had from people who write to me with suggestions, ideas and bug reports, and the connection I have felt to people who live with chronic illness every day. So, even though most days it’s difficult to sit for longer than an hour or so at my computer because of my chronic pain and fatigue, the thing which has kept me motivated to continue improving the app is you. I feel privileged to be able to work on something which has a real, meaningful impact on how people can record and communicate how they feel, and figure out what’s going on with their chronic illness. Chronic Insights is now much more than just a hobby or an app: it’s a mission.
The ❤️ 10% for charity initiative is my way to give back to charities who support people with chronic illness, who are run by amazing people who rely solely on donations to continue their work. Here’s how it works:
When you sign up to a subscription to use the premium features of Chronic Insights, you get to choose a charity (see the 10% for charity page for a list of the charities currently available)
Each year in August, I will take 10% of the revenue I receive from subscriptions (this is after a 15% which Google and Apple automatically take for any in-app subscriptions) and divide that amongst the charities on the list, weighted by how many people choose each charity
Custom Measurements
This new feature was inspired by someone who wanted to record the results of a Parkinson’s “finger tapping test”. This could perhaps been added a new type of questionnaire, but this didn’t seem quite right. So I decided to add the ability to create your own “custom measurement“, which is any arbitrary number between a given minimum and maximum value you might want to record.
This is now available as a new diary item type. To add one, scroll to the bottom of your main diary list in the Diary tab and tap on the ‘Add diary item‘ button and choose Custom Measurement (alternatively, open the main settings menu, expand the Symptom Diary section, and choose Custom Measurement). Enter a name for your measurement (eg ‘Parkinson’s finger tapping test‘), a minimum value (eg 0), a maximum value (eg 100) and a precision (whether you want to record whole numbers or decimal points). This will then be added to your diary, where you can begin making diary entries for your custom measurement.
More questionnaires
I’ve added some additional questionnaires which people have asked for:
Migraine disability assessment questionnaire (MIDAS)
Patient Health Questionnaire-9 (PHQ-9) for depression
PTSD Checklist for DSM-5 (PCL-5)
Oswestry low back pain (ODI)
Rolland-Morris disability questionnaire (RMDQ)
More blood tests
I’ve added some additional blood tests which people have asked for: B12, Vitamin D, HbA1c, high-sensitivity CRP, insulin, uric acid, magnesium, AST and GFR
Option to break continuous chart lines at 4am
The ‘break continuous line‘ option for line charts is designed to show gaps in your symptom diary data. So for example, this is what my pain chart looks like for the past few months using the ‘always join the line‘ setting:

Now, if I change this to ‘Break the line if there is more than 1 day between readings‘ setting, it looks like this - notice how you can now see the gaps where there was more than 1 day where I didn’t record anything (personally I much prefer this):

Before, the smallest gap between diary entries where the line break could occur was 1 day. In version 5.16, there is now an additional option labelled ‘4am‘, which will break the line every night at 4am. For me, this is what it looks like:

This option is only really useful if you are recording several diary entries each day. The idea behind this is that I thought the chart might be more representative to not join the line between the last pain entry I make at night, and the first pain entry I make in the morning. I’m not sure if this is better or not. What do you think?
Minor improvements to 3D
The load speed of the 3D models has been improved slightly for the Android version - it will load around 10-20% faster. I have also fixed a bug which causes the app to crash on Android under very specific circumstances when opening the 3D model.
On a personal note
I hope you’re having a reasonably good day today. I’ve been struggling more than usual with my pain and fatigue over the past month, some uveitis, and symptoms which only tend to appear when I’m going through a bad flare (a swollen knee, intense aches in my hips, and an aching jaw). I’m not sure exactly why. One possibility is that the injections of a ‘biologic‘ medication I take called certolizumab is starting to become less effective in controlling my axial SpA, but it’s difficult to tell because my pain is so random and always changing. I’m really glad that I’ve been recording my symptoms in Chronic Insights, because it’s making it much easier to figure out if my pain really is getting worse, and by how much, and it gives me something to show my doctors if I need to talk to them about possibly changing my medication.
So it’s been quite a tough month, and it’s taken me a bit longer than I hoped to get version 5.16 released, but I’ve really enjoyed reading some great reviews on the app store and emails from many of you to talk about the app. Thank you ❤️
Version 5.15 released
20 Feb 2025
Hi spoonies, I’m really pleased to announce that version 5.15 of my symptom diary app has been released, which will resolve some significant issues some people were having with some changes I made to the Health Connect and Apple Health integration in version 5.14, and I’ve also added some new bits and pieces which people have asked for.
Fixes to Health Connect and Apple Health integration
In older versions of the app, Health Connect / Apple Health integration was very basic - it just presented daily averages or daily totals for each item (for example, heart rate, steps, blood sugar, oxygen saturation etc.).

In the last update (5.14) I increased the amount of information which Chronic Insights reads from Health Connect (for people using Android) and Apple Health (for people using iPhone) so that it read every record, instead of just daily averages. There were two reasons for this: I wanted to be able to show more detail about thing like heart rate, so you can see the ups and downs throughout the day; and I wanted to add some extra metadata for things like blood sugar records (so you can for example see details about the blood sugar sample source and whether it was before or after a meal). Unfortunately, I underestimated just how much data this might involve! So, for some users, the app started slowing down and sometimes crashing, due to the weight of the data (especially heart rate - let’s say your smart watch records heart rate every 30 seconds - over 10 years that will create over 4 million records!). This was a major oversight on my behalf, for which I apologise to everyone affected. Thank you to everyone who wrote to me to report the issue.
So, for version 5.15 I have gone back to reading daily averages and totals, but made improvements: for example, for things like heart rate and oxygen saturation, it now shows not just the average, but also the maximum and the minimum, which is much more helpful. For sleep, instead of showing sleep stages (for example REM, deep sleep etc.) chronologically (which was hard to read), it shows it as a stacked bar, where the bar represents the total duration of that sleep ‘session‘, and the segments of the bar show how much time was spent in each sleep stage - a big improvement. For blood sugar and other measurements, it also shows metadata like sample source and relation to meal time.
Archive all data before a specific date
There is now a shortcut button at the top of the Diary screen to open the Archive screen, which has been improved. You can now choose to archive all data which occurred before a specific date. I introduced this for those of us who have several years worth of data in their diary - it can become quite tricky to use the green time sliders at the bottom, because the available time range is so large. By archiving everything before, for example, 6 months ago, the time sliders become much more manageable.

Quick actions menu
I’ve added a ‘quick action‘ menu for each diary item in the main Diary list: it looks like 3 little dots. This is just a shortcut to open the details page, settings page, or to archive each item.

User manual
I finally finished writing a proper user manual, which explains all the features of the app - something which a few people have asked for. If there’s anything missing from the manual which you think should be added just let me know!
Version 5.14 released
13 Dec 2024
Hi spoonies, I’ve just released version 5.14 of my symptom diary app, which has lots of new features and improvements! Thank you to everyone who emailed me with some of these suggestions.
More detailed health and vitals data
The data from Health Connect and Apple Health is now much more detailed, showing individual records (such as heart rate samples) instead of just daily aggregations.
In addition, how Vitals data is stored in the app has been completely overhauled, to support some extra metadata which some people have asked for (thank you for these suggestions!). You can now record these metadata for some of the vitals:
for blood pressure and heart rate, you can now record the body position you were in when taking the reading (eg lying down, sitting, standing)
for blood pressure you can also record where the blood pressure reading was taken from (eg left upper arm vs right upper arm)
for blood sugar you can record where your sample came from (eg capillary vs interstitial) and the relation of the sample to meals (before meal or after meal)
for stool you can record size and colour
For some of these metadata, you can also now split the chart into multiple series, for example to show separate lines for blood pressure taken from the left arm vs the right arm.
Insights tab retains state
In previous versions, when the app restarted, the Insights tab would reset, meaning that you would lose any custom charts you had configured. From version 5.14, the Insights tab now saves it’s state, so all charts are retained across app restarts.
Version 5.13 released
16 Oct 2024
Hi spoonies, a relatively small update in version 5.13 has just been released, with some improvements to the weather feature:
3 day air quality forecast can now be pinned to the top of your Diary. This was to support some users whose symptoms could be triggered by air quality, such as asthma. I’ve included the formats used by both the UK Department for Environment, Food & Rural Affairs (DEFRA) and the US Environmental Protection Agency (EPA), who score air quality on different scales.
In addition, weather charts can also optionally show a 3 day forecast! This applies to all the weather charts: temperature, pressure, humidity, cloud cover.
Version 5.12 released
Hi spoonies, I’m really pleased with the latest version 5.12, which comes with lots of new features and improvements!
There is a new scrollable timeline on Story page - this was a suggestion from a user who wanted to be able to scroll through a large timeline chart instead of using the time sliders.
I’ve also broken the link between the time filter sliders on the Diary screen and Insights tab: before, when you changed the time range on the Diary screen, it would also change the time range on the Insights screen so they were always the same. I decided it was actually better if they were not linked in this way, so that you can view different time ranges on each tab.
New Stats table on the Insights tab - this was to support a user who needed specific figures for some symptoms
The option to ‘Mirror‘ the 3D models - this is a really nice idea from a user, it allows you to view both the front and the back of the 3D models at the same time!
Increased max 3D animation speed to 16X
Improved 3D colour contrast
Added another blood test: tissue transglutaminase IgA
Version 5.11 released
Hi spoonies, this latest release has some imrovements which should hopefully make it easier to find what you’re looking for in the Diary screen, and easier to enter multiple things at once quickly. These are all suggestions from users, so once again I really appreciate those of you who have emailed me with these ideas on how to improve my app. Thank you!
Tagging diary items
You can now tag diary items (such as symptoms) to group them into whatever collections make sense for you. So for example, if you have multiple health conditions, you could tag all your symtoms with the health condition it relates to. Then, on the Diary tab, you can filter the list to show just symptoms for one of your health conditions. Tags can be assigned to more than one item, and items can have more than one tag.
Diary list grouping
The view settings (see the button at the top of the Diary tab) now has some extra options to group the diary list by type (for example, group all symptoms together, group all factors together etc) or group by tag. You might prefer this way of organising your diary to make it easier to find things!
Multiple add
The Diary screen now has a new button in the top left corner: Multiple Add. Use this to create sets of multiple things (for example, all your symptoms) to record all in one go. This is useful if for example you like to do a regular ‘check-in‘ of all your symptoms: now you can enter them all in one screen, without having to go into each one individually
I’ve also made the diary grid view slightly more compact.
Older versions
5.10.0
Improved 3D notes
Weight can now be recorded to 1 decimal place
'Now' button on duration end time
Fixed measurement increment button sometimes jumping by more than 1 unit
Notes are assigned different colours in Insights
5.9.4
Fixed positioning of camera exposure and flash controls
Show how long ago the 3 most recent data items were made in detail screen
Group identical notes in Insights item selector
Story, Year in Pixels and Insights charts handle handle multi-day spanning data items
Exclude archived items from time selection slider
X axis labels handle multi-decade timespans better
Allow up to 4 months to break line on continuous line charts
5.9.0
Option to show chart gridlines (view options button at the top of Diary)
Improved axis labels
5.8.1
Added blood tests (see Add diary item -> Blood test)
5.8.0
Added BASDAI, BASFI and FIQR questionnaires, used to measure impact of Axial SpA and Fibromyalgia (see Add diary item -> Impact questionnaire)
5.7.0
Add photos to your diary (new button above where you enter notes)
5.6.0
Added OneDrive and Google Drive as alternative backup destinations
Improved backup error notifications
5.5.0
Improved duration picker, option to set end time instead of duration
New time settings - always show full date, change arrow increment step
New 'Quick time' button for entering common times and durations more easily
Ability to record 'ongoing' symptoms and factors: come back and set an end time later
New 3D readings summary page
5.4.0
Schedule reminder notifications (see 'Main settings menu' -> 'Reminders')
5.3.0
New 'eraser' button for 3D
Change the brush size for 3D to small, medium or large
Copy 3D data from a previous entry
5.2.0
Medication chart shows daily total dose amount taken as bar chart. View total dose amount on Insights charts
Record double dose when taking medication
Improved Insights charts
5.1.4
Fixed readings from watch sometimes not saving if the phone app was closed or out of range
5.1.2
Fixed Health Connect integration on Android 14
5.1.1
Improved x-axis labels
5.1.0
In addition to symptoms, you can now record factors, vitals, medication taken / missed and mood on your watch using the Wear OS companion app (existing users: please make sure the app on your watch is updated to the latest version)
New 'list' view mode on Wear OS app
Wear OS app obeys the 'snap to whole numbers' setting for symptoms
German, Spanish, French, Italian and Chinese translations for Wear OS app
5.0.3
Bug fix: Weather data not updating
5.0.0
Record a fraction of a medication dose taken (eg ½, ¼)
Add notes to medication events
Duration is optional on discrete symptoms
Allow single-day change in med dose
Starting a new 'current' med dose automatically ends the previous current dose
Ability to archive medications
New Archive screen
New percentage label on 3D intensity slider
New diary item size and spacing options
New 3D animation speed control
Option to override the default language
Option to exclude archived items from spreadsheet export
Option to show scale values in spreadsheet export
Improved heatmap animation controls
Improved Watch settings page, ability to reorder watch items
Bug fix: 3D animation nudge buttons freezing
Bug fix: notes in story, meds missed in PDF export
4.2.19
When you add a symptom, vital, factor or mood reading, you can now attach an optional note
4.2.10
Symptom value selection wheel: option to snap to nearest whole number
Archive old symptoms and factors to de-clutter your diary (see button at the bottom of symptom / factor settings)
Option to reverse symptom chart Y axis (see switch in symptom settings)
4.2.5
Health Connect integration: bring in data from Fitbit, Samsung Health, Google Fit, MyFitnessPal, Peloton, Oura, WeightWatchers, Flo, Lifesum, Dexcom G6, Outdooractive, Proov Insight, Oculus, HealthifyMe, Weight and Measures Tracker
4.2.0
Add historical local weather to your diary to see if temperature or humidity affects your symptoms (access Weather via main menu or 'Add diary item' button)
Even less data collection (see Privacy)
Added French translation
Enabled smoothing for symptom timeline charts in Insights tab
Page layout options for Diary tab PDF export
Fixed bug exporting to spreadsheet when you have special characters / emojis in symptom name
Fixed bug loading 3D data when editing a reading
3D heatmaps generate faster
Improved the layout of the Watch tab
Improved Wear OS sync
Daily fitness data shows with correct bar width
4.1.6
Track menstrual cycle (see Vitals)
4.1.0
'Year in Pixels': see symptoms, factors and mood summarised as a pixel chart in the Story tab, and export it to PDF
Tap the clock icon to the left of the green time selection slider to enter dates manually
4.0.13
Fixed bug in saving medication dosages
New diary filter button (next to Notes button) - filter your list to show only certain categories
4.0.4
Adjust text size and contrast using the new Accessibility controls
Record medications
Augmented Reality mode when viewing your 3D heatmaps
Export your heatmap as a high-res image
Export all your charts to PDF more easily using the Share button
New light theme! see 'Theme' in settings menu
Improved compact view and detail view
Fixed drag-to-reorder items not working
3.2.23
Export Story to spreadsheet (compatible with Excel 2010 or later, Google Sheets, Open Office, Libre Office)
Compact diary mode - use the switch in the top right to switch to the new compact grid view, useful if you have a lot of symptoms. Tap to record reading, press-and-hold to reorder
3.2.18
Wear OS improvements - support latest Wear OS watches, and you can now set symptom time and duration when recording using your watch
Added 'stool' measurement (see Vitals), using the Bristol stool scale
Bug fix on PDF export - if export was not working for you, please try again and email me if you still have problems
3.2.12
Added 'peak expiratory flow' measurement (see Vitals), useful for monitoring asthma
3.2.8
New weekly and monthly Insights charts to summarise the frequency of symptoms and factors over time
Extra controls on Insights charts allowing you to show symptoms in terms of frequency or as severity, and compare symptoms and factors by value or by relative percentage
Extra controls on 3D timeline animation to make it easier to nudge forward to the next reading or back to the previous reading
3.2.6
A share button has been added to the Story section to allow you to export your story to PDF
You now access your 3D history and heatmaps from the Diary section - see the new buttons which appear underneath your symptom chart
New Story section, which shows all your activity as a chronological list
Track your mood! Enable it from the main settings menu
Improved look and feel
3.1.11
Support for Spanish and German languages!
Added oxygen saturation and heart rate to manual vitals tracking
Improved readability of vitals charts - Y axis no longer zero-based
Ability to rename factors
Some minor visual updates
3.0.34
Improved 3D mannequins
Switch any mannequin to 'skeleton mode'
Record notes on body areas
Option to show latest readings in symptom diary
Easier editing
Improved insights and export to PDF
See 3D community heatmaps
Option to use 24 hour time format
Various other improvements
3.0.25
There's a new button in the notes screen which lets you see the note in context
3.0.18
Record blood pressure, blood glucose and weight (see Vitals in Settings menu)
3.0.0
Choose between different chart types for symptoms
Record the duration of a symptom
Record different intensities for different body areas
Reorderable charts list
Record factors (things which affect your symptoms). Find these in the settings menu
Fitness tracker integration
2.0.0
Major new beta version!
You can now record symptom body location on interactive 3D mannequins
Any locations you have already recorded are still available to export, but will not be transferred to the new 3D mannequins
Thanks for being a beta tester :) As always, any feedback is highly appreciated (email james@chronicinsights.com)
1.1.2
Record symptoms and step count using a Wear OS watch (see symptom diary controls)
Backup to Dropbox so you can restore your data if you lose or change your phone (see symptom diary controls)
0.5.1
Major new beta version!
Brand new UI
Content feed for ankylosing spondylitis (will be updated over the coming weeks and months)
New calendar view in symptom diary
Thanks for being a beta tester :) As always, any feedback is highly appreciated (email james@chronicinsights.com)